Results menu
Straight Line Graph Analysis
This menu item causes Pedipod/LLD to analyze the available data and to present a report on the screen. The report may include several different sections. In each section, certain components will be absent if there is not enough data to include them.
Natural history
All of the information in this section is based on only the data prior to surgery on the leg in question.
- The leg which was originally the long leg.
- The relative growth rate of the short leg compared to the long.
- The relative length of this patient’s long leg compared to the population. This is expressed as a percentage and, although it represents the same relationship as the growth percentile, is not mathematically related to it.
- The relationship of his skeletal age to his chronological age. Because of the inaccuracy of estimating skeletal age it is inappropriate to represent this as a single number. Instead, the maximum difference between the recorded skeletal and chronological ages is shown here.
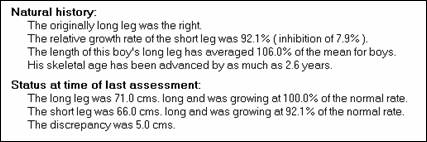
Status at time of last assessment
The information in this section takes into account the changes in growth rate caused by surgical procedures.
- The length of the long leg and its rate of growth expressed as a percentage of its normal growth rate. Note that if no surgery has been performed on the long leg Pedipod/LLD assumes that it’s rate is normal even if it is not.
- The rate of the short leg as a percentage of Pedipod/LLD’s evaluation of the growth rate of the long leg. It is therefore subject to the reservations expressed above.
- The discrepancy.
Natural unoperated prognosis
This information will only be presented for patients who have had a surgical procedure affecting leg length. It presents the situation as it existed at the time of the first surgical procedure, and attempts to depict the natural history of the leg length discrepancy had the patient not been operated upon. It includes the following:
- A prediction of the length of the long leg at maturity had there been no treatment.
- A prediction of the length of the short leg at maturity had there been no treatment.
- A prediction of the discrepancy at maturity had there been no treatment.
Straight Line Graph predictions
Information in this segment is based on all available data including that following surgery. It takes into account mainly data from the last growth segment including any surgery that follows it.
To some extent, predictions based on this data are susceptible to inaccurate data, and, to some extent, the errors due to inaccurate data are cumulative. Pedipod/LLD cannot assess and report the potential for inaccuracy in any meaningful way. As elsewhere, predictions will increase in accuracy with more assessments done over longer periods of time.
In particular, predictions are subject to errors in the measurement of the amount of lengthening achieved by a lengthening procedure. These measurements tend to be read directly from plain x-rays with no accurate accounting for magnification. A far better way is to perform scanograms immediately before and after the lengthening.
This report may include several different sections. In each section, certain components will be absent if there is not enough data to include them.
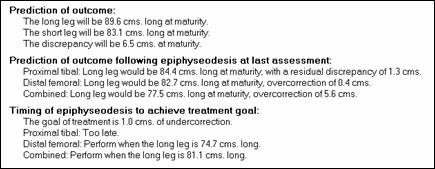
Prediction of outcome
These predictions take into account any surgery the patient may have undergone and predict the outcome at maturity if no further surgery is performed. Included are the following:
- A prediction of the length of the long leg at maturity.
- A prediction of the length of the short leg at maturity.
- A prediction of the discrepancy at maturity without treatment.
Prediction of outcome following epiphysiodesis at last assessment
These predictions have to do with the outcome at maturity if an epiphysiodesis were performed at the time of the last assessment. The predictions state the final length of the long leg and the final discrepancy in terms of undercorrection or overcorrection. Predictions are made for the following epiphysiodeses:
- Proximal tibial.
- Distal femoral.
- Combined proximal tibial and distal femoral.
Timing of epiphysiodesis to achieve treatment goal
Menelaus method
This method is applicable only to patients who have not had previous surgery.
Assumptions
The assumptions on which this method is based are restated to emphasize that certain parameters which are calculated in the Straight Line Graph method are assumed in this method. These include the rates of growth of the epiphyseal plates about the knee, the age at which growth will cease, and the rate of increase of the discrepancy.
Predictions
Based on these assumptions, two predictions are made:
- The duration of future growth.
- The discrepancy at maturity.
Corrections
The amounts of correction to be anticipated following the three types of epiphysiodesis are shown.
Comments
Pedipod/LLD scans the data for certain types of problems and reports them here. These comments may have a bearing on the accuracy of the predictions and should be reviewed. Any discrepancies or shortcomings in the data should be rectified if possible.
Several different comments may be made:
There are no assessments
No analysis can be performed if there are no data to analyze.
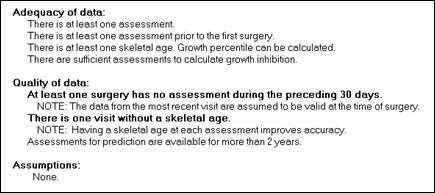
There is no assessment prior to the first surgery.
If there is no assessment prior to the first surgery Pedipod/LLD may not be able to establish a starting point for the analysis.
There is no skeletal age.
Pedipod/LLD will be able to perform a partial analysis in this case but predictions by the Straight Line Graph method will be impossible since growth percentile cannot be established. In such a case you may be willing to assume that the patient is of the mean growth percentile.
Inhibition cannot be determined with fewer than 2 assessments.
In order to calculate the growth inhibition Pedipod/LLD needs at least two assessments with the lengths of both legs recorded for each. Lacking adequate data, Pedipod/LLD will proceed with whatever parts of the analysis are still possible. In such a case you may wish to enter an assumed growth percentile for the patient.
At least one surgery has no assessment during the preceding 30 days.
Pedipod/LLD assumes that surgical procedures are performed at the time of the closest prior assessment. Ideally, the surgery and the assessment were performed on the same day. If there is an interval between the closest prior assessment and the surgery of more than 30 days then Pedipod/LLD will still do the analysis and make predictions in the usual way, but accuracy will be compromised since the leg length data was not valid at the time of the surgery.