Step by Step Instructions
for use of the Straight Line Graph
The following sample female patient will be used as an example of using the Straight Line Graph. Note that the only information used is the sex, the skeletal age and the lengths of the legs. The patient's age is not pertinent.
Sample patient | |||
| Assessments | |||
| SKELETAL AGE | LONG LEG LENGTH | SHORT LEG LENGTH | |
| 7+6 | 52.9 cm. | 49.3 cm. | |
| 9+3 | 57.1 cm. | 52.8 cm. | |
| 11+0 | 63.6 cm. | 61.0 cm. | |
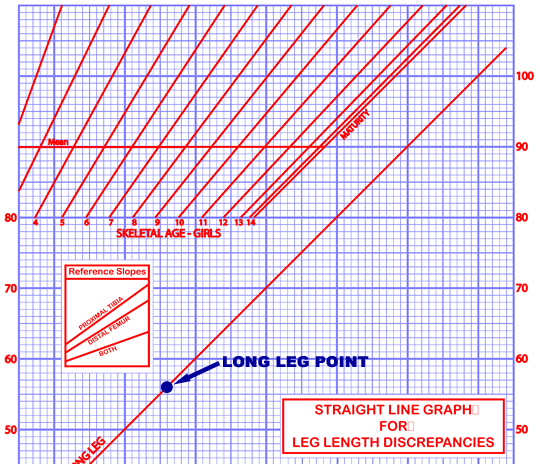
1. Plot the long leg point.
The diagonal line representing the growth of the long leg is part of the graph. The long leg length should be plotted on that line at the appropriate length.
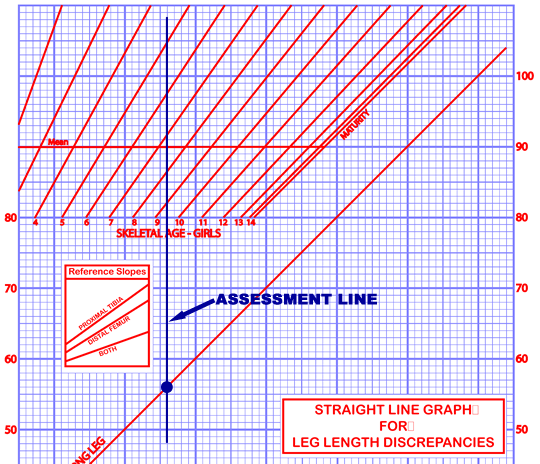
2. Draw the line for that assessment.
Draw a vertical line through the long leg point. That line represents that one particular assessment and the other two data points will be plotted on it.
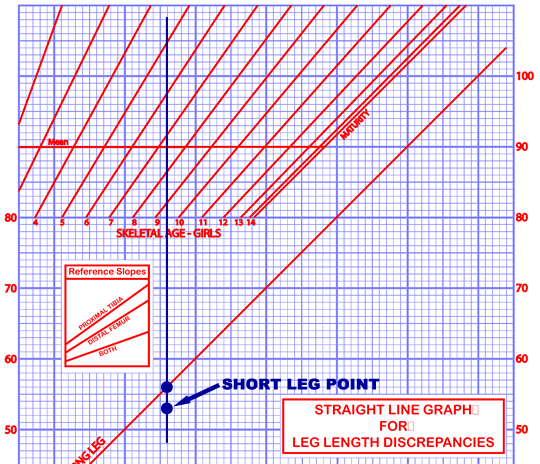
3. Plot the point for the short leg.
Plot the short leg point on the vertical line representing that assessment at the approprate length.
4. Plot the point for the skeletal age.
The nomogram area consists of sloping lines representing skeletal ages. Plot the point for the skeletal age where the vertical line for the assesment intersects the appropriate skeletal age, interpolating between the lines if necessary. Be sure to use the nomogram area for the appropriate sex. Points plotted above the 'MEAN' line suggest a child taller than the mean, and points below it a child shorter than the mean. If the skeletal age is not available omit this step.
5. Plot the other assessments.
Repeat the above steps for each of the assessments. Each assessment will be represented by a vertical line with three points on it if skeletal age is available, two points if not.
6. Draw the short leg line.
Draw the line which best fits the points plotted for the short leg. The fit should be fairly close. If it is not reread the x-rays to check the measurement of any wayward points.
7. Draw the growth percentile line.
Draw a horizontal straight line that best fits the points plotted for skeletal age. If the plotted points don't fit well resist the temptation to drawanything other than a horizontal straight line. In that case pay more attention to points of recent assessments than those of older ones.
8. Draw the maturity line.
Starting at the intersection of the growth percentile line and the maturity nomogram line, the one furthest right, drop a vertical line the height of the graph. This line represents maturity and the end of growth for the two legs.
9. Extend the growth lines to maturity.
Extend the growth lines of the two legs to the right to meet the maturity line. The intersection of these lines with the maturity line predicts the lengths of the legs at maturity in the absence of further surgery.
10. Draw the lines for epiphyseodesis done now.
There are two ways to think about the effects of epiphysiodesis. The first is to predict the effects at maturity of epiphysiosdesis done now ('now' means at the last assessment). Starting at the last point for the long leg draw three lines to the right parallel to the reference slopes printed on the graph. These three lines should extend to the maturity line and their intersections with that line represent the predicted lengths of the long leg for each of the three possible epiphysiodeses. The uppermost line, with the least decrease in slope, represents a proximal tibial epiphysiodesis, the middle represents the distal femur, and the lowest, with the most correction, represents a combined epiphysiodesis.
11. Draw the lines for epiphyseodeses that achieve equality.
The second way to think of epiphysiodis is to consider those done at a later time that achieve equal leg lengths at maturity. Starting at the point representing the short leg at maturity draw three lines to the left to intersect the growth line of the long leg. Draw only those lines that intersect to the right of the last assessment since otherwise it is already too late for that operation to achieve equality.
12. Draw the line for a lengthening of the short leg.
From the last short leg point draw a vertical line upwards for a distance representing the planned amount of lengthening. The upper end of this line represents the length of the short leg after the lengthening. Then, from that point, draw a line to the right parallel to the existing short leg line to intersect the maturity line. That intersection represents the predicted length of the short leg at maturity. This line is parallel to the existing short leg line because the leg is expected to continue to grow at the same rate.
13. Draw the line for a shortening of the long leg.
From the last long leg point draw a vertical line downwards for a distance representing the planned amount of shortening. The lower end of this line represents the length of the long leg after the shortening. Then, from that point, draw a line to the right parallel to the printed long leg line to intersect the maturity line. That intersection represents the predicted length of the long leg at maturity.